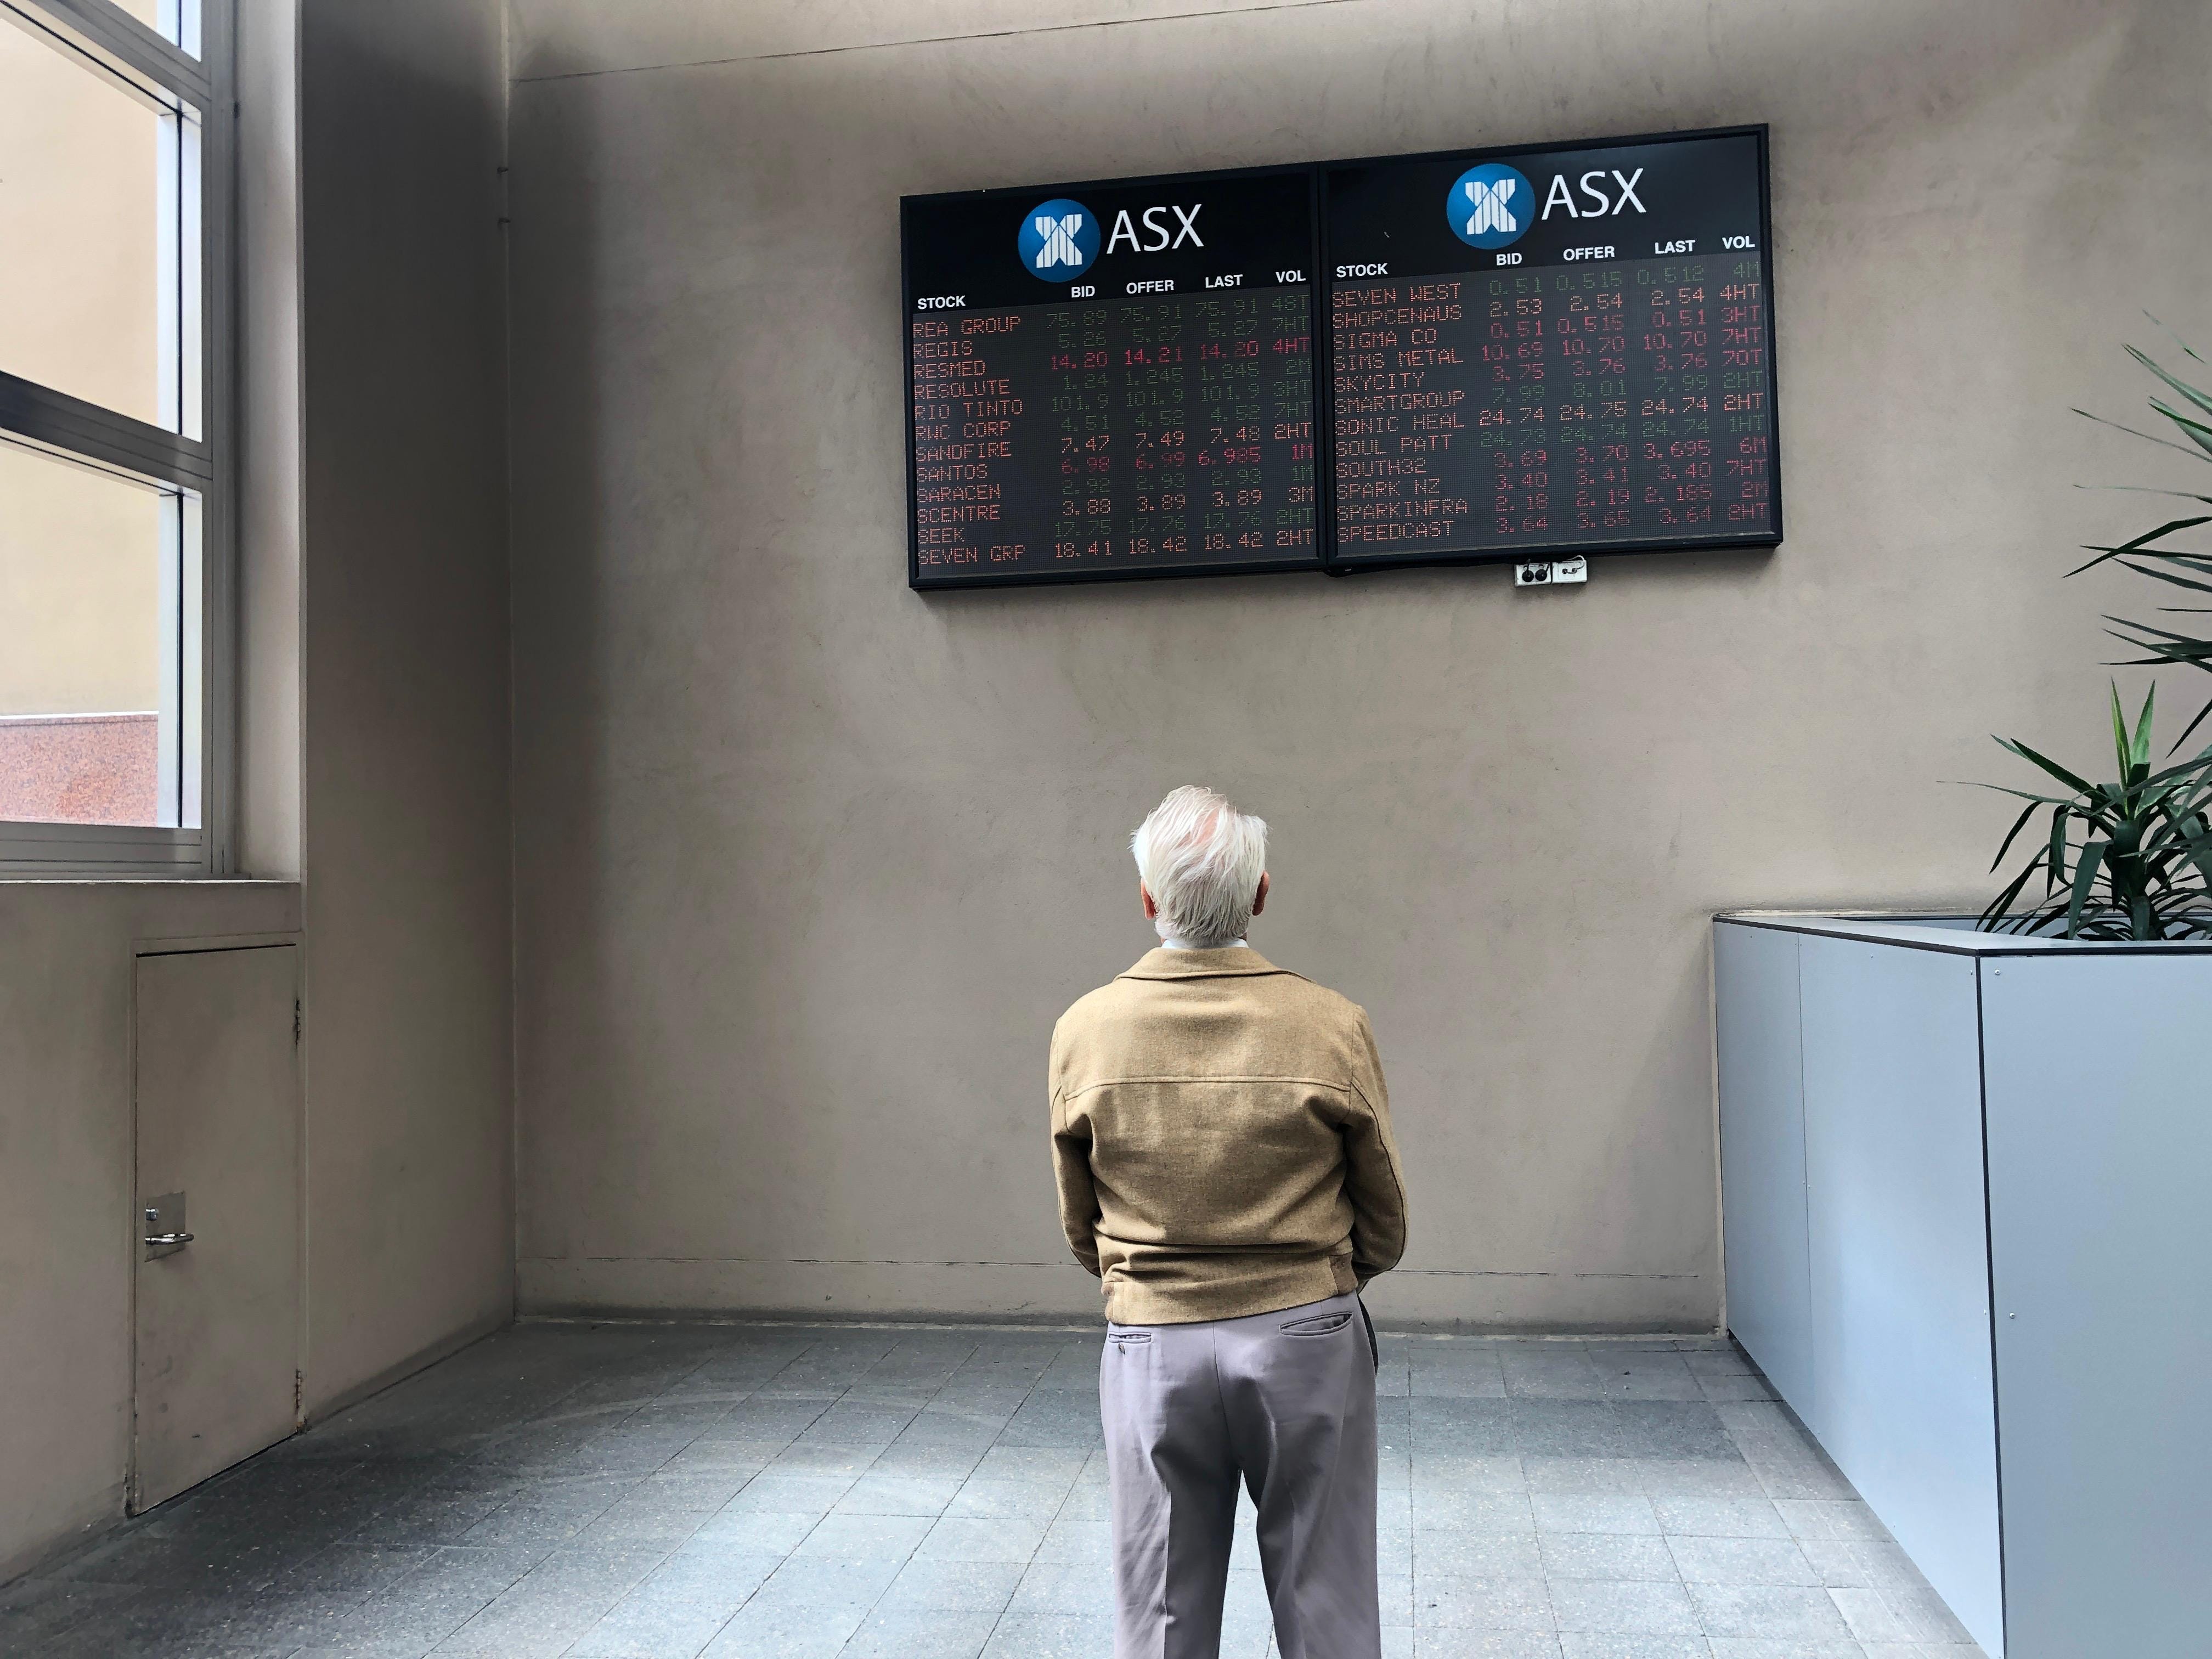
The Election Effect: What History Tells ASX Investors
When polls close and markets open, what happens next? We've crunched the numbers on every election since 1987 to find the patterns that actually matter

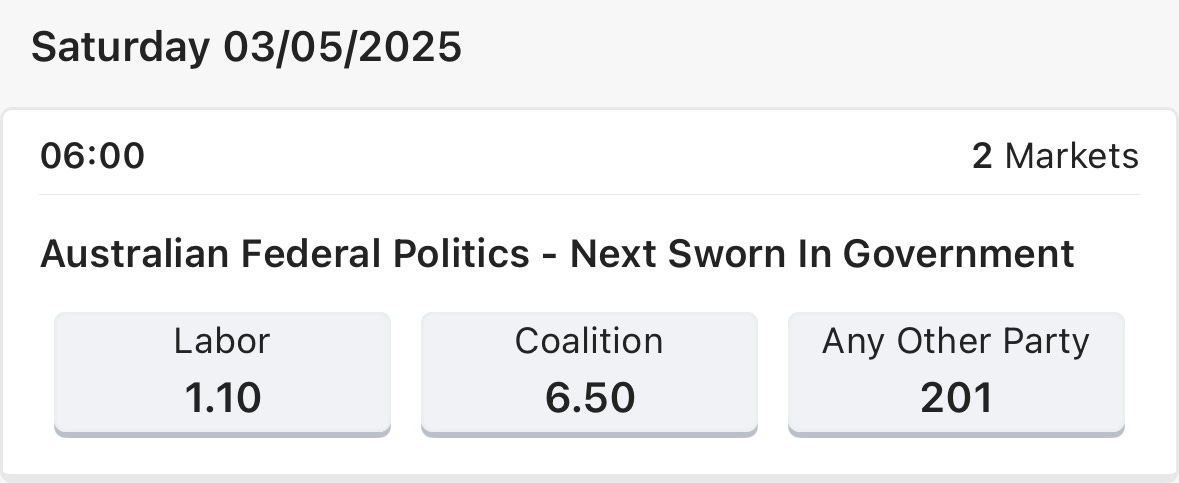
The betting markets have already crowned Saturday's election winner - with Anthony Albanese sitting at a comfortable $1.10 to hang onto the keys to The Lodge.
Peter Dutton has drifted to $6.50, putting him firmly in upset territory. He'd need to pull off something more surprising than Trump in 2016 ($5) or ScoMo's miracle win in 2019 ($6) to defy expectations.
But while the political tragics obsess over who'll form government, we're asking a different question - one that actually matters to your portfolio.
How does the Australian stock market react in the six months following a federal election?
In this month's deep dive (catch last month’s Argentina mining analysis here), we've examined every federal election since the ASX formed in 1987. Tracking the All Ords through Australia's political shifts has revealed some fascinating patterns that most investors have overlooked.
With Albanese and Dutton offering starkly different economic blueprints this Saturday, what we've uncovered might just help you position your investments for what comes after the polling booths close.

The Measure, The All Ordinaries
Before diving into the election impacts, let's talk about our measuring stick - the All Ordinaries Index.
Think of the All Ords as Australia's original market thermometer. While newer indices like the ASX 200 get more media attention these days, the All Ords gives us the most comprehensive view, tracking the 500 largest ASX-listed companies by market capitalisation.
It provides a broad overview of the Australian share market, serving as a valuable indicator of investor confidence and long-term market direction.
Born in 1980 with a modest 500-point baseline, the All Ords predates the ASX itself. Back then, each state ran its own exchange, making it nearly impossible to get a clear picture of the national market. The All Ords brought that scattered data together for the first time.
When the ASX formed in 1987, unifying those state-based exchanges, the All Ords became our national benchmark. It's since weathered the '87 crash, the tech bubble, the GFC, and countless political transitions - making it perfect for our election analysis.
Launched in January 1980 with a base value of 500 points, the All Ords was introduced to unify market performance across Australia's once-fragmented state exchanges.
For our purposes, the All Ords' broad coverage of sectors and company sizes makes it ideal for measuring how government changes ripple through the entire market, not just the top-heavy blue chips.

1987: When Australia's Markets United
Before the ASX, Australia's capital markets resembled six separate fiefdoms. Sydney, Melbourne, Brisbane, Adelaide, Hobart, and Perth each ran their own exchanges with different rules, listing requirements, and trading systems.
Imagine trying to invest across state lines - it was a nightmare of paperwork, duplication, and limited investor access.
In April 1987, these six separate kingdoms united under one banner - the Australian Stock Exchange. It was a complete reimagining of how Australia's markets would function.

The newly formed ASX quickly embraced technology, becoming one of the world's first exchanges to adopt electronic trading. While investors today take instant trades for granted, this was revolutionary stuff in the 80s.
This modernisation opened Australia's markets to greater participation and transparency and made it easier for companies to raise capital. The ASX had set the stage for decades of growth - and our analysis of how elections impact the market.
As the ASX was finding its feet, Australians were heading to the polls. Just three months after the exchange's formation, Bob Hawke sought a third term for Labor against an ambitious John Howard. This July 1987 election gives us our first glimpse at how markets respond to political change in the modern ASX era.
1987 – Hawke Wins Again as ASX Takes Shape
On 11 July 1987, Bob Hawke secured a third consecutive term for the Australian Labor Party, defeating a young Liberal leader who would later dominate Australian politics for over a decade.
The election came amidst a buoyant economy, with falling unemployment and strong consumer confidence helping solidify Hawke's hold on power.

With the newly formed ASX hitting its stride, the All Ords was trading at around 1,900 points on election day. Investors had every reason to feel confident - Australian markets had surged more than 50% in the previous 12 months alone.
Then came the crash very few saw coming.
Just three months into Hawke's new term, global markets were blindsided by Black Monday. On October 19, 1987, Wall Street plunged 22% in a single day, triggering a worldwide panic. Australia wasn't spared - the All Ords collapsed, shedding more than 30% in the six months following Hawke's victory.
It was a perfect storm:
Market euphoria turned to panic: After years of bull market exuberance, investors suddenly rushed for the exits all at once.
Black Monday crash: The sudden and sharp sell-off originated in the US, driven by a mix of program trading, overvaluation concerns, and geopolitical uncertainty.
Global contagion was swift: Australia's newly unified exchange proved efficient at transmitting international panic to local shares.
The ASX faced its first major test, and while the market damage was severe, the exchange's new structure helped prevent the system-wide failures seen in previous crises.
For Labor, this wasn't the economic backdrop they wanted, but few blamed Hawke for a global market meltdown that began in New York trading rooms.
ASX performance six months after each election
Markets Lower: 1 Markets Higher: 0
1990: Hawke's Fourth Win Meets Market Headwinds
On 24 March 1990, Hawke guided Labor to an unprecedented fourth consecutive election victory, narrowly defeating the Liberal-National Coalition led by Andrew Peacock.
However, the economic picture was darkening. The "recession we had to have" (as Paul Keating would later call it) was brewing just beneath the surface.

The All Ords was trading at around 1,560 points on election day. However, over the following six months, the market fell to 1,350 points, a decline of around 14%.
Several homegrown economic challenges shaped the market's direction during this period:
Interest rate pain: The RBA had cranked rates to eye-watering heights (17% at their peak) to fight inflation.
Tightened lending conditions: Banks tightened lending after the excesses of the 1980s, starving businesses of capital.
Rising unemployment: Job losses were accelerating, with unemployment climbing towards double digits.
For investors, a pattern was starting to emerge — Labor won in both 1987 and 1990, and markets fell after each. But with 1987 shaped by the Black Monday crash, it’s hard to pin the blame on politics alone.
ASX performance six months after each election
Lower: 2 Higher: 0
1993 – Keating's "Sweetest Victory" and a Market That Backed It
On 13 March 1993, Paul Keating led the Australian Labor Party to a surprise election victory over the Liberal-National Coalition, then led by John Hewson.
The upset win largely came down to one policy - Hewson's ambitious "Fightback!" reform package centred on introducing a 15% GST. Voters weren't convinced, particularly as Australia was still emerging from recession.

For the first time in our analysis, markets rallied after a Labor win. The All Ords sat at 1,660 points on election day and climbed steadily to 1,930 points over the next six months - a healthy 16% gain.
What changed this time around?
Global markets finding their groove: Bill Clinton's America was finally hitting its stride, dragging the rest of the world up with it.
Interest rates stopped the rollercoaster: After years of the RBA yanking rates up and down like a yo-yo, they finally gave businesses a breather.
Recession hangover lifting: That recession was finally in the rearview mirror. Growth ticking up, jobs coming back. It felt like the economic headache was finally easing after a rough couple of years.
ASX performance six months after each election
Lower: 2 Higher: 1
1996 – Howard's Landslide Victory and Market Response
On 2 March 1996, the Liberal-National Coalition, led by John Howard, achieved a decisive victory over the incumbent Australian Labor Party, ending 13 years of Labor governance under Bob Hawke and Paul Keating.
The electoral map turned blue almost everywhere, with the Coalition picking up a massive 45-seat swing. Howard entered office with a clear mandate to reshape Australia's economic landscape.

Despite the decisive political shift, markets barely reacted. The All Ords stood at 2,290 points on election day and six months later had dipped slightly to 2,270 points - essentially flat during a major political transition.
Why the muted response? A mix of factors were at play:
Cautious economic transition: Howard's team moved deliberately on economic reforms, focusing first on spending cuts rather than dramatic policy shifts.
Priced-in expectations: The markets had long anticipated Howard's victory and had already adjusted accordingly
Asian economic uncertainty: Early warning signs of what would become the Asian Financial Crisis were appearing on the horizon.
ASX performance six months after each election
Lower: 4 Higher: 0
1998 – Howard's Narrow Win Amid Market Volatility
On 3 October 1998, Prime Minister John Howard secured re-election for the Liberal-National Coalition, defeating Kim Beazley's Australian Labor Party.
Despite losing the two-party-preferred vote (49.02% to Labor's 50.98%), the Coalition retained government by winning more seats in the House of Representatives.
It was a surprise result in an election dominated by the newly introduced GST and the aftermath of the Asian Financial Crisis.

Markets absolutely lapped it up. The All Ords jumped from 2,570 points on election day to 2,900 six months later - a tidy 13% gain when many were just hoping things wouldn't get worse.
Several factors drove this bullish response:
Resources waking up: Commodity prices bounced back from their slump, breathing life into our resources heavyweights. BHP and Rio were smiling again.
The RBA playing nice: Interest rates held steady, giving everyone a much-needed break from the economic whiplash of the early 90s.
Global markets finding their feet: After the Asian wobbles, international investors started dipping their toes back in the water.
ASX performance six months after each election
Lower: 4 Higher: 1
2001 – Howard Wins Amid Global Uncertainty and Domestic Resilience
The 2001 election played out against an extraordinary backdrop. Just two months before polling day, the September 11 attacks shocked the world. Closer to home, the Tampa affair had thrust border protection and national security into the national spotlight.
Howard, already skilled at reading the public mood, pivoted his campaign to focus on national security and border control. On November 10, voters delivered him a third consecutive term, choosing stability during uncertain times.

Markets reflected this preference for continuity. The All Ords stood at 3,200 points on election day and edged up to 3,300 points over the next six months - a modest 3% gain during a period of global turbulence.
Several factors supported this steady performance:
Economic safe haven: Australia's economy appeared increasingly insulated from global shocks, attracting international capital.
Property boom beginnings: The market was just starting its ridiculous climb that would eventually have us all complaining about prices over smashed avo brunches.
Budget strength: Howard and Costello's continued budget surpluses contrasted sharply with growing deficits overseas.
Rising resource markets: Early signs of a commodities recovery buoyed sentiment in resource stocks.
ASX performance six months after each election
Lower: 4 Higher: 2
2004 – Howard Secures a Fourth Term as the Market Surges
On 9 October 2004, Prime Minister John Howard led the Liberal-National Coalition to a fourth consecutive election victory, defeating Mark Latham's Labor Party in a decisive result.

It marked Howard's most dominant performance to date, with the Coalition gaining control of the Senate, a rarity in Australian politics.
Markets loved the result. The All Ords sat at 3,700 points on election day and surged to 4,150 points over the next six months - an impressive 12% rise during a period that would later be recognised as the early stages of the mining boom.
Three key drivers fuelled this bull run:
The China effect: Chinese demand for Australian resources hit overdrive, particularly for iron ore and coal. Mining stocks surged as export volumes broke records, lifting the broader market with them.
Business and consumer confidence: Low interest rates and solid job growth pushed the economy along and markets higher.
Fiscal discipline, tax cuts: The Howard government's focus on surplus budgets and middle-class tax relief was well received by both the electorate and the financial sector.
ASX performance six months after each election
Lower: 4 Higher: 3
2007: Rudd's Victory Collides with Global Crisis
On 24 November 2007, Kevin Rudd and his "Kevin 07" campaign swept Labor back to power in a decisive victory over John Howard's Coalition, ending 11 years of Coalition rule.

The All Ords was flying high at 6,400 points on election day, reflecting years of mining boom prosperity. Six months later, the picture was starkly different - the index had tumbled nearly 10% to 5,800 points.
But Rudd's government couldn't take the blame. The culprit was emerging halfway across the world:
GFC storm clouds: What began as American subprime mortgage issues was rapidly transforming into a global financial meltdown.
Credit markets freezing: Banks worldwide became increasingly reluctant to lend as the true scale of toxic assets became apparent.
Resources vulnerable: Despite strong fundamentals, Australian mining stocks couldn't escape the global equity sell-off.
ASX performance six months after each election
Lower: 4 Higher: 4
2010: Hung Parliament Defies Market Gravity
The 2010 election delivered what many feared - deadlock. On August 21, Australians voted but couldn't decide between Julia Gillard, who had controversially replaced Kevin Rudd just months earlier, and Tony Abbott's Coalition.
The result was Australia's first hung parliament in 70 years. Neither major party secured the 76 seats needed for majority government, leaving the country in limbo for an agonising 17 days while Gillard negotiated with independents to form a minority government.

Conventional wisdom suggests markets hate uncertainty, yet the All Ords defied expectations. From 4,500 points on election day, the index climbed steadily to around 5,000 points over the following six months - an impressive 11% gain despite the political drama.
Two key factors helped markets shrug off the political uncertainty:
China's insatiable appetite: Despite political wobbles at home, Australia's resources continued flowing to China at record prices, keeping the economic engine running
Steady monetary hand: The RBA maintained policy stability through the political turmoil, providing markets with a crucial anchor.
ASX performance six months after each election
Lower: 4 Higher: 5
2013 – Abbott Sweeps to Power, Markets React Calmly
On 7 September 2013, Tony Abbott delivered a crushing Coalition victory that ended six tumultuous years of Labor government, which was marked by leadership spills, policy U-turns and internal warfare.
The Coalition secured 90 seats in the House of Representatives, compared to Labor's 55, delivering Abbott a comfortable majority.

The All Ords stood at 5,200 points on election day and rose modestly to 5,400 over the following six months - a steady if unspectacular 4% gain that reflected cautious investor optimism.
Why didn't markets surge more?
Resources running out of steam: The mining boom that had powered Australia's economy was showing signs of fading as iron ore prices began their long descent.
Global monetary uncertainty: Markets worldwide were jittery about the US Federal Reserve's plans to wind back quantitative easing
Commodity volatility: As iron ore and coal prices began to weaken, resource stocks were pressured, which weighed on broader index performance.
ASX performance six months after each election
Lower: 4 Higher: 6
2016 – Turnbull Scrapes Through, Market Stays Steady
On July 2, Malcolm Turnbull's Coalition limped across the line with a one-seat majority - a far cry from the commanding position many had predicted when he deposed Tony Abbott in an internal party coup.
Despite the knife-edge political result, markets showed remarkable resilience. The All Ords sat at 5,300 points on election day and climbed steadily to 5,800 points six months later - a healthy 9.4% gain that had little to do with domestic politics.

Two external factors drove this strong performance:
The Trump effect: The surprise election of Donald Trump in November 2016 sparked a global market rally as investors anticipated American tax cuts and infrastructure spending.
Mining's second wind: Iron ore prices staged an unexpected recovery, nearly doubling from their 2015 lows and breathing new life into Australia's resources sector.
ASX performance six months after each election
Lower: 4 Higher: 7
2019 – Morrison's Surprise Win Boosts Markets
On 18 May 2019, Scott Morrison pulled off what he himself called a "miracle" - a Coalition victory that blindsided pollsters, pundits and probably even Bill Shorten's Labor Party, who had spent years preparing for government.

Markets wasted no time showing their approval. The All Ords stood at 6,400 points on election day and climbed steadily to 6,850 points over the following six months - a solid 7% gain that reflected investor relief.
The post-election rally was driven by renewed investor confidence, particularly in sectors that had feared regulatory or tax changes under a Labor government.
What drove this post-"ScoMo" surge?
Policy certainty: Labor's proposed changes to negative gearing, capital gains tax and franking credits were shelved, removing significant investor anxiety.
Stability and continuity: Morrison's win meant policy continuity in taxation, housing, and superannuation, which was reassuring for investors.
Global sentiment improvement: US-China trade tensions eased slightly, providing a supportive backdrop for risk assets.
ASX performance six months after each election
Lower: 4 Higher: 8
2022 – Albanese Takes Power as Labor Returns
On 21 May 2022, Anthony Albanese led Labor back to government after nine years in opposition, defeating Scott Morrison's Coalition with a campaign focused on climate action, aged care reform, and tackling the spiralling cost of living that was squeezing household budgets everywhere.
Voters were clearly after something different. They'd had enough of the Morrison government's climate foot-dragging and integrity issues, so Labor's promises on both fronts hit the mark after some fairly chaotic years under ScoMo.

Market reaction was notably muted. The All Ords stood at 7,300 points on election day and barely moved over the following six months, closing at around 7,350 points - a modest 0.7% gain during a period of significant global challenges.
Several major headwinds kept a lid on post-election market performance:
Aggressive rate hikes: The RBA embarked on its steepest tightening cycle in decades, raising rates seven times in six months to combat surging inflation.
Global energy crisis: Russia's invasion of Ukraine sent energy markets into turmoil, driving up costs for businesses and consumers.
Recession fears: Growing concerns about a potential global downturn weighed on investor sentiment across most major markets.
ASX performance six months after each election
Lower: 4 Higher: 9
The Numbers Are In
After tracking market movements across 13 federal elections since the ASX formed, a striking pattern emerges.
Nine elections saw the All Ords climb in the following six months, while only four saw declines. That alone suggests a positive election effect, but dig deeper and the partisan divide becomes pronounced.
Labor's Mixed Market Legacy
Labor's track record is evenly split. Of their six election wins since 1987, markets rose after three (Keating 1993, Gillard 2010, and Albanese 2022) and fell after three (Hawke 1987, Hawke 1990, and Rudd 2007).
Recent Trend
Interestingly, the partisan pattern has softened in recent years. The most recent five elections - regardless of which party won - all saw markets climb in the following six months.
With Labor heavily favoured heading into this weekend's election, investors might take comfort in this newer trend rather than the historical pattern.

How Each Leader Could Shape Markets
Let's examine the economic blueprints both leaders are taking to voters this Saturday and what they might mean for your investments.
Labor's Albanese: Government-Led Growth
Albanese's economic agenda centres on three pillars:
Cost of living relief: The main economic message around cost-of-living measures and helping bring costs down.
Future Made in Australia Act: An economic policy aimed at boosting domestic manufacturing, especially in renewables and critical minerals
Budget management balancing act: Walking the tightrope between managing rising expenditure and addressing calls for structural tax reform. Albanese has promised no changes to negative gearing or capital gains tax, but investors remain wary of potential policy shifts.
Coalition's Dutton: Private Sector Focus
Tax reform focus: Favours broader tax reform and has criticised Labor’s reliance on “big government” spending.
Energy security & gas development: Supportive of fossil fuel development, including more gas extraction projects like those in the Beetaloo Basin.
Tighter fiscal management: A stricter stance on spending, criticising the government’s approach to inflation and productivity.

Which Policy is More Market Friendly?
From a stock market perspective we believe that Peter Dutton’s policies may be viewed more favourably by the ASX, particularly by large-cap resource, energy companies.
However, Albanese’s domestic manufacturing push and incentives for critical minerals could benefit selected sectors, especially small-cap exploration and tech-focused industrials.
Overall, markets typically favour pro-business and pro-growth tax policies, which is why we give the edge to Dutton.
What to Expect From Markets in the Next Six Months
If Labor Wins (The Likely Outcome)
Historical patterns suggest some caution. Looking at Labor's election wins since 1987, the market has fallen in three out of six cases - that’s a 50% hit rate for bears and bulls.
However, the most recent trend tells a different story. The past five elections (regardless of winner) have all seen markets rise in the following six months. Albanese's 2022 victory was actually followed by a modest market gain, breaking Labor's historical pattern.

Beyond Politics: The Bigger Market Drivers
While election results matter, several other forces will likely have greater influence over the next six months:
Interest rate cuts: With the RBA widely expected to cut rates at least twice this year, capital should flow from bank deposits to equities as savings returns diminish.
Structural cash flow: Record low unemployment and continued migration mean superannuation contributions remain strong, providing ongoing market support.
Leadership continuity: Markets typically respond well to policy predictability - if Labor retains power as expected, the continuation of existing policies removes one uncertainty.
The American Wild Card
What could throw a curveball into all of this is a recession in US markets. Investment bank JP Morgan is predicting a 60% chance of a US recession in 2025, while Goldman Sachs is saying 45%.
If US markets tumble into recession, Australia faces a difficult challenge. The last time America experienced a recession (owing to the tech bubble bursting) without Australia following suit was back in 2001 during the tech bubble collapse. That's not a pattern we've managed to repeat since.

Our Balanced Prediction
Our final prediction is a bit of a bet each way: If US markets can avoid a recession, the ASX will rise over the next six months. If the US is to have a recession, we expect the ASX to be down, but only just over the next six months.
The Final Word: Elections Matter, But They're Not Everything
With the All Ords down nearly 10% from its record highs in February, many may be forgiven for thinking that we have further to drop. No doubt, many others will feel the worst is behind us, and we reach for new highs.
It's interesting to take a historical look at the ASX and what has occurred in the six months post-federal election. Although some trends remain intact, if financial markets have taught us anything, it's not to be complacent.
Investors should stay focused on the fundamentals of their investments rather than focusing on election uncertainty. If you have a portfolio that you haven't checked in on for some time, now might be the time.
Look beyond the election noise and keep tabs on the stuff that really moves the needle - such as what's happening in US markets, where interest rates are heading, that sort of thing. And (this might sound obvious) make sure you actually understand what you've bought and can stomach seeing your portfolio in the red when markets inevitably take a wobble.
Election results may grab headlines, but it's the quiet, persistent trends in revenue, earnings, and economic conditions that ultimately determine whether your investments thrive. Stay alert, stay diversified, and remember that in investing - as in elections - past performance is no guarantee of future results.